

Building a tree diagram in D3.js
In the past few weeks, I have spent some time evaluating some visualization frameworks in Javascript. The most prominents ones include: Javascript InfoVis Tookit, D3 and Protovis. Each of them is feature rich and provides a varieties of configurable layouts. In particular I was impressed with D3 as it gives a nice balance of features and flexibility and allowed me to build just the visualizations I wanted. In this post, I want to take a quick dive into using D3 for building a tree diagram.
A brief course on D3
One of the most striking features of the D3 framework is the use of selections, which allows you to add, update and remove elements in one single chained call. It does this by maintaining an inner-join between the data and the render-elements. This is a pretty powerful feature and greatly aids in building visualizations.
Every render element has an __data__ property that contains the bound data. New render elements will not have the __data__ property and will be created. Existing render elements will get updated and render-elements that have __data__ but no corresponding presence in the new data set will be removed. With that context, the call chain below should look more meaningful.
layoutRoot
    .selectAll('path.link')
    .data(links)
    .enter()
    .append('svg:path')
    .attr('class', 'link')
    .attr('d', link);
This selects all SVG Path elements with a class name of ”link” from the parent element: layoutRoot. We enter the selection with a binding to data(), followed by enter(). By entering the selection, we create the inner-join which will automatically know which elements to create and which ones to update. These calls are part of the Selection API. D3 also has APIs for doing animations (Transitions), data processing, computing a varieties of layouts and generating shapes using SVG.
Other powerful features of D3 include:
- Easy mapping of data to Html elements and vice versa
- Flexibility to choose your own render elements (be it html or svg)
- Simple API to configure the layouts and styling
- Animation support with the transition API
Building the Tree
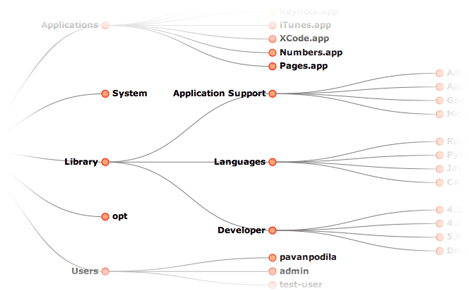
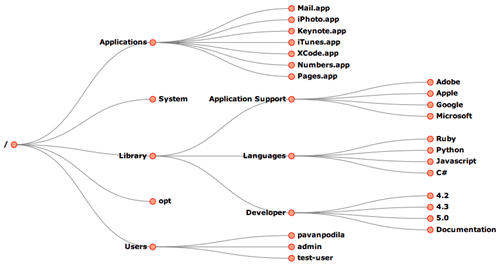
For this blog post, I am going to use sample tree data that looks like so:
var treeData = {
    name: '/',
    contents: [
        {
            name: 'Applications',
            contents: [
                { name: 'Mail.app' },
                { name: 'iPhoto.app' },
                { name: 'Keynote.app' },
                { name: 'iTunes.app' },
                { name: 'XCode.app' },
                { name: 'Numbers.app' },
                { name: 'Pages.app' },
            ],
        },
        {
            name: 'System',
            contents: [],
        },
        {
            name: 'Library',
            contents: [
                {
                    name: 'Application Support',
                    contents: [{ name: 'Adobe' }, { name: 'Apple' }, { name: 'Google' }, { name: 'Microsoft' }],
                },
                {
                    name: 'Languages',
                    contents: [{ name: 'Ruby' }, { name: 'Python' }, { name: 'Javascript' }, { name: 'C#' }],
                },
                {
                    name: 'Developer',
                    contents: [{ name: '4.2' }, { name: '4.3' }, { name: '5.0' }, { name: 'Documentation' }],
                },
            ],
        },
        {
            name: 'opt',
            contents: [],
        },
        {
            name: 'Users',
            contents: [{ name: 'pavanpodila' }, { name: 'admin' }, { name: 'test-user' }],
        },
    ],
};
d3.layout.tree() is the starting point for tree layouts in D3. The call to this function returns an object that contains a bunch of methods to configure the layout and also provides methods to compute the layout.
var tree = d3.layout
    .tree()
    .sort(null)
    .size([size.height, size.width - maxLabelLength * options.fontSize])
    .children(function(d) {
        return !d.contents || d.contents.length === 0 ? null : d.contents;
    });

var nodes = tree.nodes(treeData);
var links = tree.links(nodes);
You can ignore the call to the size()method, it is just setting the width and height of the tree, passing in as a 2-element array ([w,h]). If you are curious why I have the size.height as my first element, its because I am rotating the tree by 90 degrees. We will see more about his further down the post. The children()function is more interesting, as it tells the tree layout about the child nodes of the data-item. In my example, the contents property represents the children, as seen in the treeData variable above.
The next two methods, nodes() and links()does what you expect. It recurses through the data (by calling children() on each item) and computes the layout info for each data item. The links() method takes the output of nodes() and computes the edges between the different nodes. We are storing this computed layout in the nodes and links variables, each of which is a flat array of elements. Each element in the nodes array is a wrapper around the original data item with augmented layout info, whereas each element in the links array is a wrapper around the node item. Below you can see these wrapper objects:
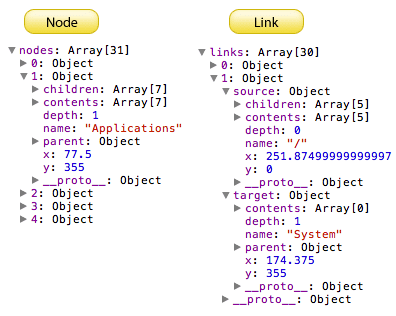
The node item is augmented with the children, parent, x and y properties. The link item just has the source and target properties, which represents the edge from the parent to the child respectively. You can see that the source and target properties point to the node objects.
Rendering the tree
Now that we have the layout computed, the next step is to setup the UI elements that render the data and layout. For the tree diagram we are going to use SVG, although the same layout can also be achieved using plain Html,CSS with absolute positioning. To create our UI elements, we will use D3’s selection API, as mentioned above, to generate the SVG elements and set properties based on the computed layout.
/*
     <svg>
         <g class="container" />
     </svg>
  */
var layoutRoot = d3
    .select(containerName)
    .append('svg:svg')
    .attr('width', size.width)
    .attr('height', size.height)
    .append('svg:g')
    .attr('class', 'container')
    .attr('transform', 'translate(' + maxLabelLength + ',0)');

// Edges between nodes as a <path class="link" />
var link = d3.svg.diagonal().projection(function(d) {
    return [d.y, d.x];
});

layoutRoot
    .selectAll('path.link')
    .data(links)
    .enter()
    .append('svg:path')
    .attr('class', 'link')
    .attr('d', link);

/*
     Nodes as
     <g class="node">
         <circle class="node-dot" />
         <text />
     </g>
  */
var nodeGroup = layoutRoot
    .selectAll('g.node')
    .data(nodes)
    .enter()
    .append('svg:g')
    .attr('class', 'node')
    .attr('transform', function(d) {
        return 'translate(' + d.y + ',' + d.x + ')';
    });

nodeGroup
    .append('svg:circle')
    .attr('class', 'node-dot')
    .attr('r', options.nodeRadius);

nodeGroup
    .append('svg:text')
    .attr('text-anchor', function(d) {
        return d.children ? 'end' : 'start';
    })
    .attr('dx', function(d) {
        var gap = 2 * options.nodeRadius;
        return d.children ? -gap : gap;
    })
    .attr('dy', 3)
    .text(function(d) {
        return d.name;
    });
The code above creates the root container (SVG with a Group (<g>) element) and adds the edges first followed by the nodes and text labels. This order ensures that the nodes and labels always stay on top of the edges. You can also see the use of the .data().enter() method chain to setup the inner-join for binding data to UI. The attr() method is used to set properties on the SVG elements. One thing to note here is that we are creating a group (<g>) element to hold both the node (<circle>) and the label (<text>). Also this group element is translated by [y, x], ie. by interchanging the original layout co-ordinates. We do this to rotate the tree by 90 degrees. This rotation makes the labels more readable.
I would heartily recommend D3.js to anyone looking into building 2D visualizations in Javascript. Although it has a slight learning curve, it is worth the effort and allows building some fancy visualizations. Do take a look at the examples to see the capabilities of this library.